Variability of New STR Loci and Kits in US Population Groups
Applied Genetics Group, National Institute of Standards and Technology, Gaithersburg, Maryland, USA
Publication Date: 2012
Abstract
Over the past few years, Promega Corporation, Applied Biosystems (now Life Technologies Corporation) and Qiagen have released a number of new short tandem repeat (STR) typing kits to aid worldwide efforts in forensic DNA testing and human identification. The most recent STR kits were developed primarily due to expansion of the European Standard Set of STR loci and the U.S. core loci used for the Combined DNA Index System. These new commercially available STR kits utilize different combinations and subsets of 24 autosomal STR loci: CSF1PO, FGA, TH01, TPOX, vWA, D3S1358, D5S818, D7S820, D8S1179, D13S317, D16S539, D18S51, D21S11, D2S1338, D19S433, Penta D, Penta E, SE33, D1S1656, D12S391, D2S441, D10S1248, D22S1045 and D6S1043. In addition, Promega supplies five additional autosomal STR loci as part of the PowerPlex® CS7 System, which is primarily used in relationship testing laboratories. The CS7 loci include F13A01, F13B, FESFPS, LPL and Penta C. In July 2012, Promega released the PowerPlex® Y23 System, which includes six additional Y-chromosome STRs beyond the Applied Biosystems Yfiler® kit: DYS481, DYS533, DYS549, DYS570, DYS576 and DYS643. The Applied Genetics Group at the National Institute of Standards and Technology has examined a standard set of U.S. population samples across the 29 autosomal STR loci and the 23 Y-STRs available in commercial STR kits. This article describes the observed variability of STR loci in 1036 unrelated (primarily male) samples from U.S. Caucasian, Hispanic, Asian and African American self-declared ancestries.
Introduction
Over the past few years, Europe and the United States have worked to expand core sets of genetic markers used for routine forensic DNA testing and human identification. This expansion will aid international data-sharing capabilities with more loci in common and reduce the potential for adventitious matches as DNA databases grow in size. The European Standard Set (ESS) of short tandem repeat loci increased from seven to 12 core loci in 2009 (1) (2) (3) . The FBI Laboratory has announced plans to expand from a core set of 13 autosomal STRs used in its Combined DNA Index System (CODIS) to at least 18 loci in the near future (4) (5) (6) . Commercial STR typing kits have been released by Promega Corporation (Madison, WI) and Life Technologies/Applied Biosystems (Foster City, CA) to meet these core loci expansion needs.
Table 1 lists the U.S. and European core loci and the 29 autosomal STR loci found in commercial kits involved in the present study, which is focused on recently released kits from Promega and Applied Biosystems. For more information and specific details regarding the loci and kit configurations, see Advanced Topics in Forensic DNA Typing: Methodology (7) or our recent article in Forensic Science Review (8) . As noted in a recent study, genotypes from these autosomal STR loci are not associated with any known phenotypes and therefore do not reveal any potentially sensitive or medically relevant information (9) .
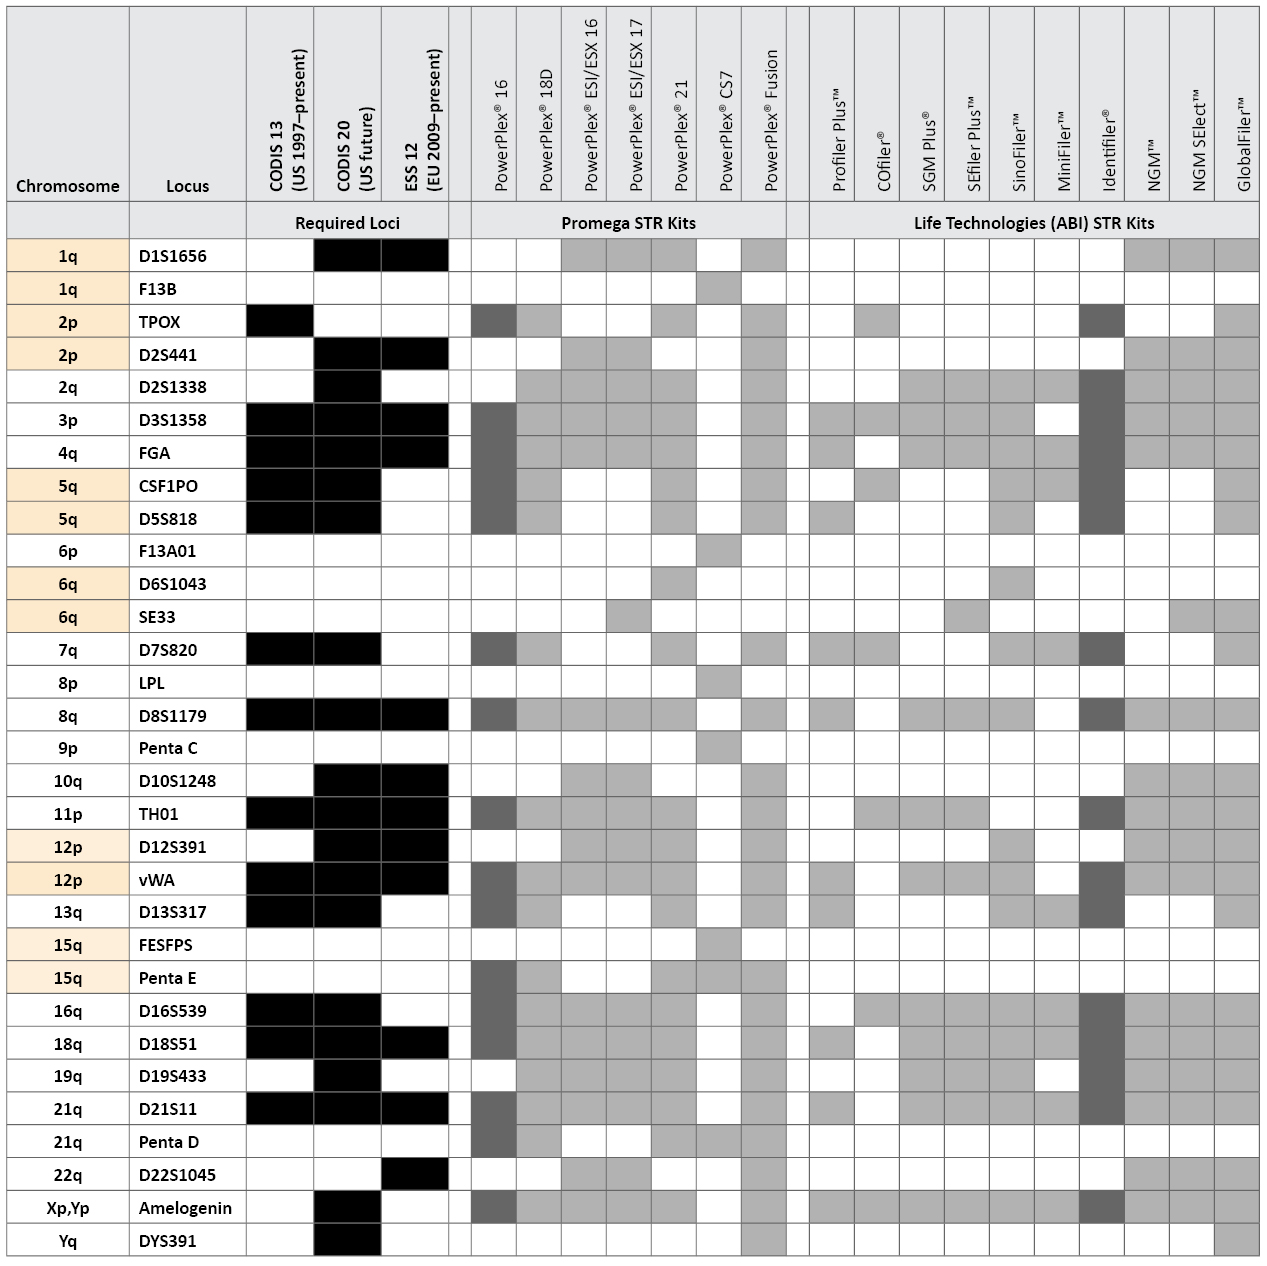 Table 1. STR loci and kits examined in this study along with United States and European Union required loci. Loci are listed by chromosomal position, with syntenic pairs highlighted in yellow. The GlobalFiler™ kit also includes a Yindel to confirm AMEL Y.
The recently released PowerPlex® Fusion (Promega Corporation) and GlobalFiler™ (Life Technologies) STR typing kits include loci that are unfamiliar to many U.S. crime laboratories such as D12S391, D1S1656, D10S1248, D2S441, D22S1045 and SE33. Although this article does not cover any direct performance work with the PowerPlex® Fusion or GlobalFiler™ kits, we discuss the combination of loci present in these kits and their relative variability in U.S. population samples. We also examine five additional STR loci that are only found in the PowerPlex® CS7 System, which is primarily used by relationship testing laboratories. The PowerPlex® CS7 additional loci are F13A01, F13B, FESFPS, LPL and Penta C (see www.promega.com/products/genetic-identity/str-analysis-for-forensic-and-paternity-testing/powerplex-cs7-system/). In July 2012, Promega released the PowerPlex® Y23 System (see www.promega.com/products/pm/genetic-identity/powerplex-y23/), which includes six additional Y-chromosome STRs (Y-STRs) beyond the Applied Biosystems Yfiler® kit: DYS481, DYS533, DYS549, DYS570, DYS576 and DYS643. In this article, we also explore the benefits of these additional Y-STRs.
Over the past decade, the Applied Genetics Group at the National Institute of Standards and Technology (NIST) has studied a standard set of U.S. population samples across numerous genetic markers of interest to the human identity testing community (see www.cstl.nist.gov/strbase/NISTpop.htm). This article describes the relative variability of individual STR loci—and thus the potential resolving power for combinations of loci found in commercial STR kits—through examining 1036 unrelated samples from U.S. Caucasian, Hispanic, Asian and African American sources across 29 autosomal STR loci and 23 Y-STRs.
Materials and Methods
Sources of DNA Samples: The DNA samples and their sources have been described in previous publications (10) (11) (12) . Anonymous donors with self-identified ethnicities were obtained from Interstate Blood Bank (Memphis, TN), Millennium Biotech, Inc. (Ft. Lauderdale, FL) and DNA Diagnostics Center (Fairfield, OH). Our complete data set of almost 1450 samples (12) contains related individuals including father and son samples for studying mutation rates (11) .
In the present collection of unrelated individuals, only the sons were used from the father-son sample set. In addition, all matching, single-mismatch or double-mismatch Y-STR haplotypes produced from PowerPlex® Y23 were subjected to kinship calculations across the autosomal STR loci to help identify any potential close (first or second degree) relatives in the data set. After this screening process, a final set of 1036 unrelated individuals was selected: 361 U.S. Caucasians, 342 African Americans, 236 U.S. Hispanics and 97 U.S. Asians. There are 1032 males and four females (two Caucasian, one African American and one Asian). The female sample names are C82B, C38A, MT94831 and UA16927.
DNA Results: For the past decade, the NIST U.S. population and father-son samples have been repeatedly examined with over 20 different commercial STR typing kits (and in some cases, prerelease prototype materials) for concordance study purposes (13) . Some of these studies have been published (12) (14) (15) (16) (17) (18) (19) , and others will be made available in the near future.
Details regarding any primer-binding-site mutations discovered during our concordance testing have been shared directly with the collaborating company, which has enabled improved products for the international DNA community. In some cases, primers may have been redesigned (and samples retested to verify concordance in allele calls) prior to kit release. In other instances, extra degenerate primers have been included (and samples retested) in final commercial kit multiplexes to enable PCR amplification of the regular and null or variant allele possessing a primer-binding-site mutation (7) (20) .
For work with commercial STR kits, manufacturer amplification and capillary electrophoresis protocols were followed with the exception of running half-volume PCRs for selected STR kits. Data were collected on Applied Biosystems® 3130xl and 3500 Genetic Analyzers as described in previous publications (12) .
Profiles also have been generated on these same DNA samples (or subsets) using in-house-developed multiplexes such as various miniSTR assays (14) (21) (22) (23) and the NIST 26plex (24) . Y-chromosome haplotypes have been produced with PowerPlex® Y (25) , Yfiler® (11) , in-house Y-STR assays (26) (27) , rapidly mutating Y-STRs (28) and PowerPlex® Y23. Portions of our Y-STR data are included in the YHRD (www.yhrd.org) and US Y-STR (www.usystrdatabase.org) databases.
Over 100 autosomal single nucleotide polymorphism (SNP) markers have been assessed on a subset of these samples (29) (30) (31) as have 50 Y-SNPs (32) , 68 insertion/deletion (Indel) markers (33) , 16 X-chromosome miniSTR loci (34) and the Argus X-12 kit (35) . In addition, the Armed Forces DNA Identification Laboratory has conducted mitochondrial DNA control region sequencing (36) (37) and complete mitochondrial genome analysis (38) on a fraction of these samples. Many of these results are available at: www.cstl.nist.gov/strbase/NISTpop.htm
Data Analysis: An Excel®-based software tool was developed by David Duewer (NIST Analytical Chemistry Division) to perform calculations of allele and genotype frequencies as well as the probability of identity values reported in this article. This software is planned for future release on the NIST STRBase web site: www.cstl.nist.gov/strbase/software.htm. Hardy-Weinberg equilibrium assessment of the autosomal STR loci was performed using PowerMarker v3.25 (39) .
Results and Discussion
Benefits of Our Repeated Study of the Same DNA Samples: Three aspects that can affect overall quality and reliability of DNA results include 1) the presence of primer-binding-site mutations (that can lead to absent alleles failing to be called), 2) incorrect categorization of a sample into its appropriate population group (that can lead to a slight skewing of frequencies if true differences exist between population groups) and 3) the presence of relatives in a data set when unrelated individuals are being assumed (again this scenario can skew frequencies due to an overabundance of allele sharing among related individuals). Each of these issues—albeit in typically a very minor amount—can potentially shift the observed allele frequency from the “true” allele frequency that exists in a population.
Although usually rare (≈0.1% (17) ), primer-binding-site mutations can give rise to typing results that do not reflect the true underlying alleles present in a DNA sample. Most university and forensic labs conduct population genetic research or casework with only a single STR typing kit. Therefore, investigators do not typically have the opportunity to cross-check results with different PCR primer pairs. It is worth noting that, by using consistent primers within a laboratory, question and known samples will agree if both contain the same primer-binding-site mutation. In other words, false homozygotes caused by allele dropout in a heterozygote when a primer fails to anneal properly and extend are not a problem within a laboratory. It is with interlaboratory comparisons and DNA databases supplied with results from multiple laboratories using different kits where potential null alleles can cause artificial mismatches. Of course, some DNA database search strategies incorporate reduced stringency to avoid false negatives that can arise with null alleles from a specific STR kit (7) .
As noted above, our NIST population samples have been well characterized for human identity testing markers and repeatedly examined with autosomal, Y-chromosome, X-chromosome and mtDNA markers. Some of the commonly used STR loci, such as D18S51, have been examined with more than a dozen different PCR primer pairs (17) . Detailed characterization of our DNA samples with redundant typing results, which were obtained due to probing the same region of DNA multiple times on the same samples with different PCR primer sets, increases confidence that our final data set is free of potential null alleles from specific primer-binding-site mutations. Thus, concordance studies aid typing result quality assurance.
Known Null Alleles Have Been Removed from Our Data Set: In our final data set, we report the correct underlying data in spite of the fact that a specific STR kit may not amplify all of the alleles reported. For example, African American sample GT37178 has a mutation in the amelogenin X allele primer-binding site for PowerPlex® 16 and Identifiler® STR kits, such that only the amelogenin Y allele is amplified (40) . However, in our final genotypes table, GT37178 is listed as containing an X,Y type for amelogenin because it amplifies correctly with other PCR primer pairs. In this same manner, with Hispanic sample ZT80731, D18S51 is reported as a 13,15 genotype in spite of the fact that all Applied Biosystems kits (Identifiler®, NGM SElect™, etc.) do not detect the allele 13 (17) due to a primer-binding-site mutation G→A 172 nucleotides downstream of the STR region that affects the reverse primer (41) .
Self-Identified Sample Ancestries Have Been Confirmed with Ancestry-Informative Markers: Many of our DNA samples have been studied with ancestry-informative markers (30) (31) . In studies where autosomal, Y and mtDNA loci were compared (30) , we obtained appropriate haplogroups for the lineage markers, which aided our confidence in the sample clustering and self-declared ancestries of our DNA donors.
Related Samples Have Been Removed from Our Data Set: Only sons were included from our full father-son set of information. In addition, we have used the Y-STR (and in some cases mtDNA) lineage marker results to help screen out potential relatives for our final unrelated data set. An advantage of examining our DNA sample sets with many different loci and STR typing kits is the ability to identify potential relatives (42) . An example helps illustrate our screening process. Hispanic samples ZT79994 and ZT79995 share a total of 22 alleles at 22 loci out of 24 autosomal loci studied (only D12S391 and Penta D have nonoverlapping heterozygous alleles). This sample pair also exhibits a full match across the 23 Y-STR loci in PowerPlex® Y23 and possesses the same mtDNA control region sequence. A full Y-STR match suggests that either a father-son or a brother-brother relationship is possible. However, identical mtDNA control region sequences make it more likely that these sample sources are brothers. Kinship calculations produced likelihood ratios of zero for a parent-child relationship, 56300 for full siblings, 5690 for half-siblings (or uncle-nephew, grandfather-grandson) and 264 for first cousins. Thus, the genetic results are much more likely if ZT79994 and ZT79995 are brothers than unrelated individuals or even other close relatives. With this additional information, we have pulled ZT79995 from our data set, leaving ZT79994 to represent this individual’s family in our final unrelated data set.
Autosomal STR Markers
Relative Performance of the 29 Autosomal STR Loci: For human identification applications, loci that exhibit a high degree of variability among individuals are typically preferred so that samples from different sources can be appropriately separated from one another. There are several measures of genetic markers to help assess their relative variability. These include the number of observed alleles, the number of observed genotypes, the heterozygosity (which is a fractional evaluation of the total number of heterozygotes in a set of samples) and the probability of identity.
The probability of identity (PI) is the chance that two unrelated people selected at random will have the same genotype (43) . The PI value of a single locus is determined by summing the square of the observed genotype frequencies. Thus, the lower the PI value, the more variable the genetic marker is in the measured population because there are more genotypes occurring at a lower frequency. Individual locus PI values can be multiplied together with independently inherited loci to create a profile PI (i.e., the product rule). The PI value is a better measure of locus performance than the total number of observed alleles or genotypes because specific alleles may occur in a relatively high frequency and reduce the overall variability, especially if a number of rare alleles occur at this locus. Ideally, we would like to observe a fairly even level of variation across many genotypes at each locus so that there is a greater chance of finding a difference between two unrelated individuals selected at random.
Table 2 ranks the variation observed in our 1036 U.S. population samples across all 29 autosomal STR loci and DYS391 that are part of commercial STR kits as noted in Table 1. The information in Table 2 is listed with the most variable loci at the top (by probability of identity values). Note that there are several loci that are better than D18S51, the top performer for the current CODIS 13 loci. The most variable locus in our data set is SE33 with 52 observed alleles, 304 different genotypes, 93.5% heterozygosity and a PI value of 0.0066. The least variable autosomal STR is TPOX with 9 alleles, 28 genotypes, 69% heterozygosity and a PI value of 0.1358.
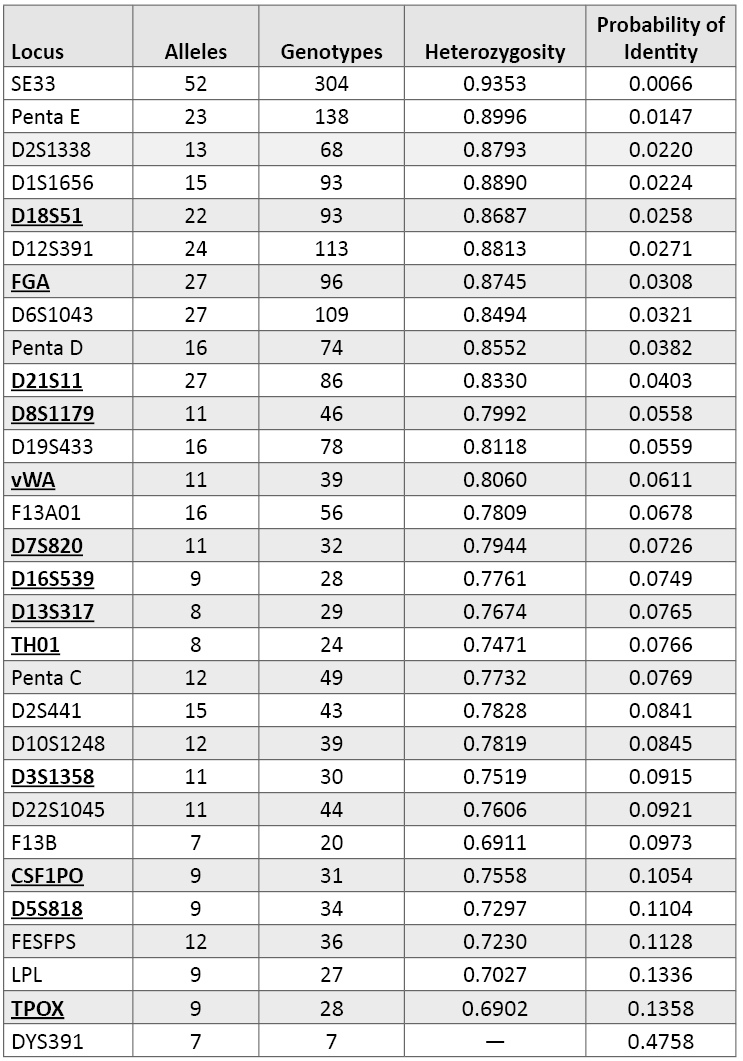 Table 2. Variation observed across 1036 U.S. population samples with 29 autosomal STR loci and the Y-STR locus DYS391. Loci are rank ordered by their probability of identity values. The current CODIS 13 core loci are shown in bold font and are underlined. DYS391, as a single-copy Y-STR marker, has no heterozygosity and exhibits the poorest ability to resolve samples from one another.
Comparing and contrasting these marker metrics can be instructive. For example, D2S1338 displays only 13 alleles and 68 genotypes yet has the third best probability of identity score and the fifth best heterozygosity value (87.9%). This means that D2S1338 has a more even distribution of frequencies across the observed alleles compared to a marker like D3S1358 that has 11 alleles but only 30 genotypes with about 75% heterozygosity and a PI of 0.0915. Almost 80% of our D3S1358 results contain alleles 15, 16, or 17, while the top three D2S1338 alleles 17, 19, and 20 account for only 42% of the observed variation at the more polymorphic D2S1338 locus. On a per-locus basis, a marker such as D2S1338, which has a broader distribution of variation across its alleles, will be more effective at detecting DNA mixtures from multiple contributors than D3S1358 even though the total number of possible alleles is not that different. Thus, with locus variability it is the distribution of genotypes that matters rather than the total number of alleles observed.
Table 3 examines relative rankings of the 29 autosomal STRs and DYS391 with our four different population groups. In all four groups, SE33 is the top-performing locus. Penta E has the second highest PI value in three of the four populations—only exceeded by D1S1656 and D12S391 in our Caucasian data. Most of the other top ten performing loci (down to D21S11) remain in the top ten of each population group. It is interesting to note some population-specific differences such as D6S1043, which ranks 8th overall but 3rd with Asians. In reality, D6S1043 is not performing that much better in Asians in terms of absolute PI value across our population groups but rather the other loci such as D2S1338, D1S1656, D18S51 and D12S391 are not quite as variable in our Asian samples compared to the other population groups. Our Penta C data compares well to previous data reported on African American, Asian, Caucasian and Hispanic samples (44) .
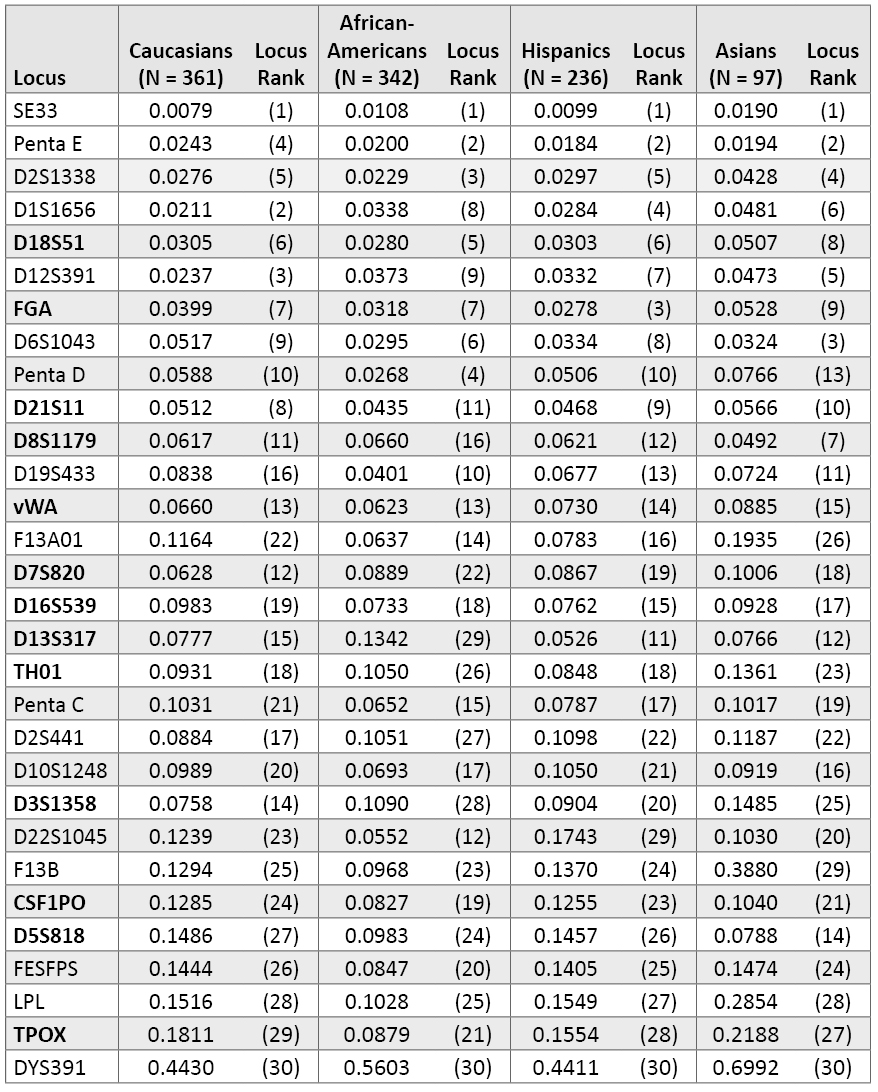 Table 3. Probability of identity values for individual population groups (listed in same order as Table 2).
 Penta D ranks 4th in African Americans with a PI value of 0.0268 and 13th in Asians because of a poorer PI value of 0.0766. The new loci D1S1656 and D12S391 rank higher in our Caucasian samples (2nd and 3rd) compared to our African Americans (8th and 9th). Some of the lower-ranking loci such as D5S818 and TPOX demonstrate fairly dramatic population variability. D5S818 has a PI value of 0.0788 with Asians, where it ranks 14th, but a PI of 0.1486 in Caucasians, where it ranks 27th. TPOX is 21st in African Americans with a PI of 0.0879 yet it is 29th in Caucasians with a PI of 0.1811. One of the typically moderate performing markers D13S317 was 11th with our Hispanic data (PI = 0.0526) but 29th in African Americans (PI = 0.1342). On the other hand, the new STR locus D22S1045 did much better in African Americans (PI = 0.0552; 12th overall) than Hispanics (PI = 0.1743; 29th overall).
This type of variability across different population groups (Table 3) illustrates the need to examine locus variability across populations of interest rather than trying to rely solely on a combined population ranking of genetic markers such as shown in Table 2.
Chromosomal Location of the 29 Autosomal STR Loci: With an increase in the number of autosomal STR loci combined in a multiplex assay comes the potential to have loci that are located in close proximity in the human genome on a specific chromosome—and thus not always inherited independently. Without independent genotype assortment, the simple product rule does not accurately estimate genotype and profile frequencies. Perhaps in an ideal world we would only use loci located on separate chromosomes so that we could have full confidence in independent genotypes from autosomal loci. However, with the prior work on specific STR loci and the availability of primer sets in commercial kits, we sometimes have to work in a less than ideal world. As seen in Tables 1 and 4, there are seven pairs among the 29 autosomal STRs that are located on the same arm of a chromosome (i.e., syntenic loci) (45) .
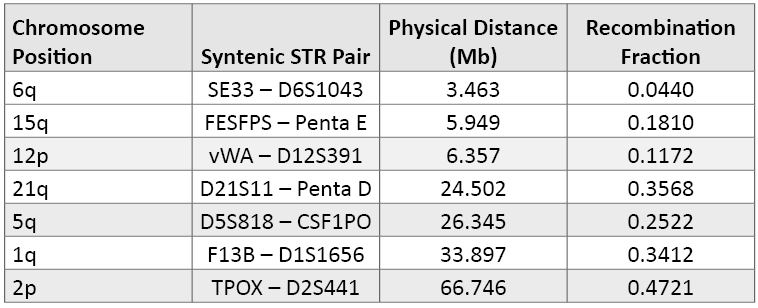 Table 4. Syntenic STR loci (i.e., those markers found on the same arm of various chromosomes) ranked by their physical distance. The physical distance in megabases (Mb) and recombination fraction are from reference 45. As noted by Phillips, the recombination activity between two genetic markers is more important than the physical distance in terms of ensuring independent genotype assortments in multiplex DNA profiles.
Loci that originally were characterized and developed for separate kits have now been combined as core locus expansion has occurred. The first of these locus “conflicts” was the adoption of D12S391 during the 2009 ESS expansion. D12S391 is located just over 6 million nucleotides away from vWA on the short arm of human chromosome 12 (Table 4). The classical assumption is that markers should be at least 50 megabases (Mb) apart to ensure recombination between the loci (i.e., effective shuffling of the genome deck of cards with each generation). However, recombination rates are not fixed across the human genome, and recombination hotspots have been discovered (46) . Several studies have shown that the D12S391-vWA loci are in linkage disequilibrium and genotype frequencies can be multiplied because there is no strong association between the loci when examining unrelated individuals (47) (48) (49) (50) . However, when examining closely related individuals it can be safer to work with linked D12S391-vWA haplotype frequencies rather than multiplying the individual genotype frequencies (51) .
Table 4 provides more detail regarding the seven pairs of syntenic STR loci. Some of these syntenic loci have been used extensively without any known adverse effects, such as D5S818 and CSF1PO, which are 26Mb apart on the long arm of chromosome 5. Both D5S818 and CSF1PO are required for the current CODIS 13 core. Likewise, D21S11 and Penta D, which are separated by 24Mb on the long arm of chromosome 21, are part of the PowerPlex® 16 System. TPOX and D2S441, which are on the short arm of chromosome 2, are part of the expanded U.S. loci but separated by more than 50Mb (Table 4). FESFPS and Penta E are both part of the PowerPlex® CS7 System, and FESFPS-Penta E haplotypes have been studied to aid kinship analysis (52) . Currently, there are no STR kits that utilize SE33 and D6S1043 or F13B and D1S1656 in the same multiplex assay.
Exploring Capabilities of Sets of Loci Present in STR Kits: With the probability of identity values for different loci and an understanding of potential challenges with syntenic loci, we can examine how various sets of markers would perform across the four U.S. population groups and our combined set of data.
Table 5 contains the probability of identity values found by multiplying individual locus PI values together to meet the CODIS 13, ESS 12 and CODIS 20 requirements (see Table 1 for the loci present in each set). Each of these core sets of loci represents a minimum requirement in terms of loci to include in a commercial kit. It is important to keep in mind that decisions have been made by manufacturers regarding the specific combinations of loci beyond the core requirements. In addition, relative sizes of the same STR loci may be shifted so that loci that are small in one kit may be larger in another kit (12) . Thus, equivalent loci may not be successfully recovered from badly degraded DNA samples. With these caveats, we can discuss the relative performance of loci present in various STR typing kits.
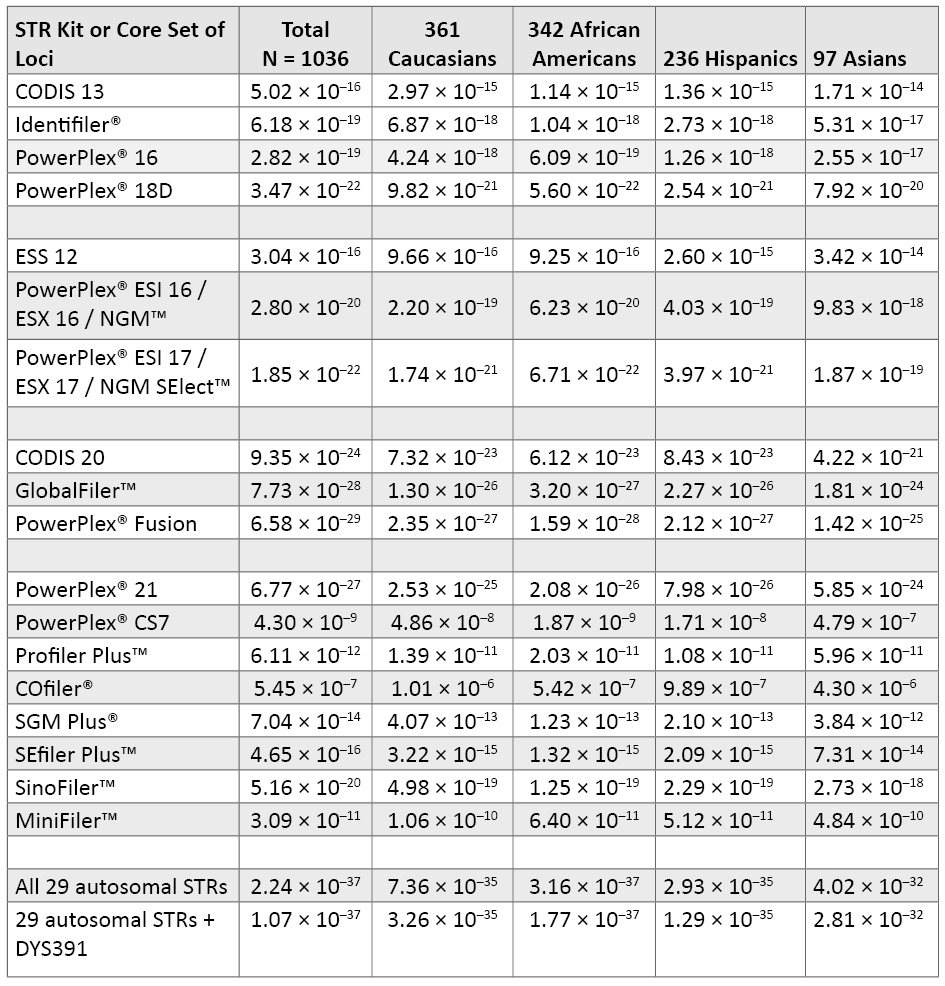 Table 5. Probability of identity for various sets of STR loci, which illustrates the resolving power of different STR typing kits on the same DNA samples. See Table 1 for combinations of STR loci present in each kit. Amelogenin, which offers little to the probability of identity, was not included in the CODIS 20 calculations.
The two most widely used kits currently in the United States are Identifiler® and PowerPlex® 16. These STR kits have the CODIS 13 core loci and the sex-typing marker amelogenin in common and differ by the D2S1338 and D19S433 loci in Identifiler® and the Penta D and Penta E loci in PowerPlex® 16. Note that there is very little difference in performance between Identifiler® and PowerPlex® 16. From the full 1036 data set, PI values for Identifiler® (6.18 × 10⁻¹⁹) and for PowerPlex® 16 (2.82 × 10⁻¹⁹) are within the same order of magnitude. The addition of D2S1338 and D19S433 to the PowerPlex® 16 loci results in a PI value that is about three orders of magnitude better (PI = 3.47 × 10⁻²²) for the PowerPlex® 18D System.
The STR kits developed to meet the ESS 12 requirements also include D2S1338, D19S433 and D16S539 (53) . Thus, the PowerPlex® ESI 16, PowerPlex® ESX 16 and NGM™ kits all contain the same 15 STRs and amelogenin and exhibit the same PI values (Table 5). PowerPlex® ESI 17, PowerPlex® ESX 17 and NGM SElect™ kits all add the SE33 locus, which improves their power of discrimination by almost two orders of magnitude (2.80 × 10⁻²⁰ to 1.85 × 10⁻²²). Developmental validation studies for these three kits have been published (20) (54) (55) .
The goal of creating a multiplex to meet the proposed CODIS 20 loci (4) (5) has been met and exceeded with 24plex assays that were recently released. The GlobalFiler™ kit (Life Technologies, 2012; see www.slideshare.net/Lifetech_HID/globalfiler-webinar) is a 6-dye multiplex that includes the proposed CODIS 20 plus TPOX, D22S1045, SE33 and an insertion/deletion marker from the long arm of the Y chromosome to aid amelogenin result verification. PowerPlex® Fusion (Promega, 2012; see www.promega.com/products/pm/genetic-identity/powerplex-fusion) is a 5-dye multiplex covering the CODIS 20 plus TPOX, D22S1045, Penta D and Penta E. Thus, the STR differences between these 24plexes are SE33 for GlobalFiler™ and the two pentanucleotide loci for PowerPlex® Fusion. From our data set calculations, it appears that PowerPlex® Fusion with Penta D and Penta E will provide a slightly better probability of identity than the GlobalFiler™ kit with SE33 (Table 5).
Table 5 also includes the levels of variability that can be expected with other Promega and Applied Biosystems kits described in Table 1 as well as the entire set of 29 autosomal STRs plus DYS391 (under the assumption of independence between all loci).
As can be seen in Tables 2 and 3, SE33 is by far the most polymorphic locus among the 29 autosomal STR loci used in commercial STR kits currently supplied by Applied Biosystems and Promega (56) . A review of the SE33 literature has found more than 175 alleles when internal sequence rearrangements are included (7) . A number of single-base variants exist in SE33, which can require more care in the capillary electrophoresis separations needed to accurately type DNA samples at this locus. In addition, flanking-region mutations have affected amplicon mobility and led to discordant results with different PCR primer pairs. In particular, a G→A mutation 68bp downstream of the SE33 repeat region has been detected that can cause a mobility shift in PowerPlex® ESI 17 relative to PowerPlex® ESX 17 and NGM SElect™ SE33 alleles (57) (58) (59) . To remove this SE33 discordance issue, the PowerPlex® ESI 17 Pro System was developed with redesigned primers (18) .
The reason that SE33 is so variable is that it has a high mutation rate. At 0.64%, the rate is more than three times higher than the average mutation rate of most tetranucleotide STR loci (see www.cstl.nist.gov/strbase/mutation.htm). While the large numbers of alleles make SE33 excellent for mixture detection and interpretation, addressing relationship testing across one or more generations may be more challenging with the higher mutation rate of SE33. However, because SE33 is a core locus for the German national DNA database, an increasing number of labs in Europe are beginning to include it.
Variant Alleles Observed in Autosomal STR Loci: A number of variant (i.e., non-integer repeat) alleles were observed in our data set (Table 6). In some cases, these variant alleles are included within kit allelic ladders. Table 6 also describes alleles observed that migrated outside the range of an allelic ladder for at least one of the STR kits examined. Not surprisingly, the more variable loci have a greater number of variant alleles. For example, SE33 possesses a series of x.2 alleles ranging almost consecutively from 10.2 through 34.2. There is very little information described in the literature so far with D6S1043. We found a number of x.3 alleles with D6S1043 and an 18.1 variant in our data set. D12S391 had both x.1 and x.3 alleles and a 22.2 variant. In total, 20 of the 29 autosomal loci had some variant alleles.
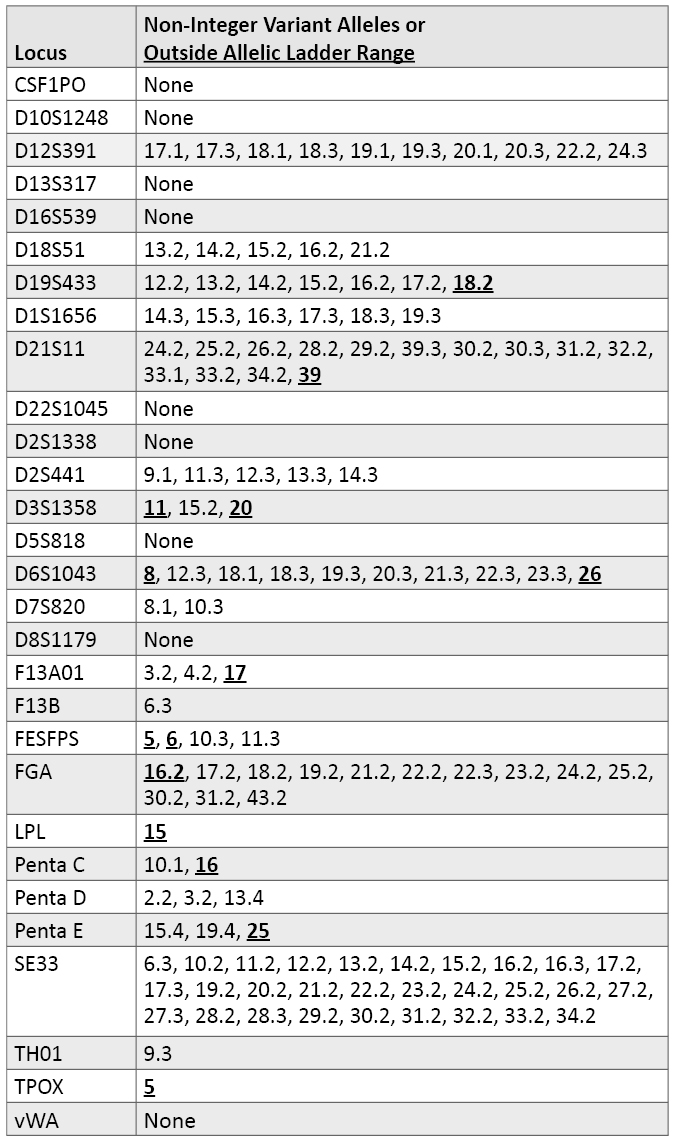 Table 6. Variant alleles observed in autosomal STR loci.
 Y-Chromosome STR Markers
Y-STR Loci in PowerPlex® Y23: Until the recent release of PowerPlex® Y23, the Yfiler® kit from Applied Biosystems was the largest commercially available Y-STR multiplex. The Yfiler® kit amplifies 17 regions of the Y chromosome (60) although some researchers cite Yfiler® as having only 16 loci. The highly polymorphic Y-STR locus DYS385 is duplicated and produces two amplicons (termed “a” and “b”) with a single PCR primer pair. PowerPlex® Y23, which was released by Promega in July 2012, contains six additional loci and provides better resolution of haplotypes from unrelated males (61) . Figure 1 displays the relative locations along the Y chromosome of the 22 (or 23 if the duplicated DYS385 is counted twice) Y-STR loci present in the PowerPlex® Y23 System. The six new loci that go beyond the ones present in Yfiler® are indicated in bold font.
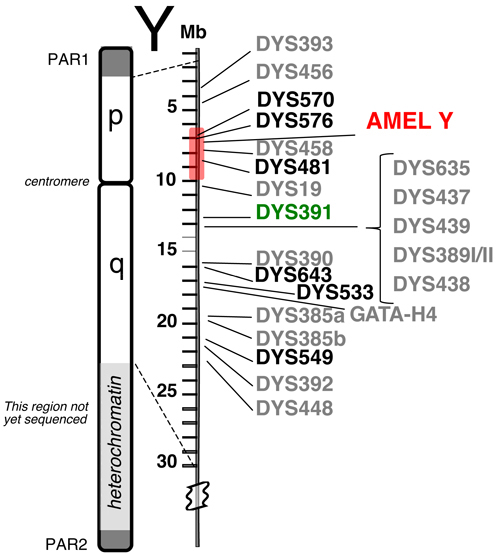 Figure 1. Relative positions of 23 Y-STR loci available in the PowerPlex® Y23 System.
 The six new loci are shown in bold font. PAR1 and PAR2 are pseudo-autosomal regions on the tips of the Y chromosome that recombine with the X chromosome. The shaded region around AMEL Y can sometimes be deleted (e.g., reference 63), causing loci such as DYS458 to be missing from an otherwise full Y-STR profile. DYS391 is located a sufficient distance away to avoid deletions affecting AMEL Y.
Relative Performance of PowerPlex® Y23 Loci: Table 7 lists the individual Y-STR locus probability of identity values. Typically the metric used for Y-STR markers is marker diversity, which is effectively one minus the probability of identity used here. The overall PI values are much lower for Y-STR loci compared to autosomal markers because only a single allele is typically present at each locus—with the notable exception of DYS385a/b. Again, as observed in Table 3 with the autosomal loci, there are population group differences in marker variability. For example, even though DYS385a/b is the top-ranked Y-STR locus in all population groups, it is less polymorphic in Caucasians (PI = 0.1482) compared to the other groups (e.g., Asian PI = 0.0549). Likewise, DYS19 ranks lower in Caucasians compared to other groups. On the other hand, DYS456 ranks relatively higher in Caucasians. Of the six new loci, the trinucleotide DYS481 is the highest ranked single-copy Y-STR. DYS576 and DYS570 also rank near the top in every population (Table 7).
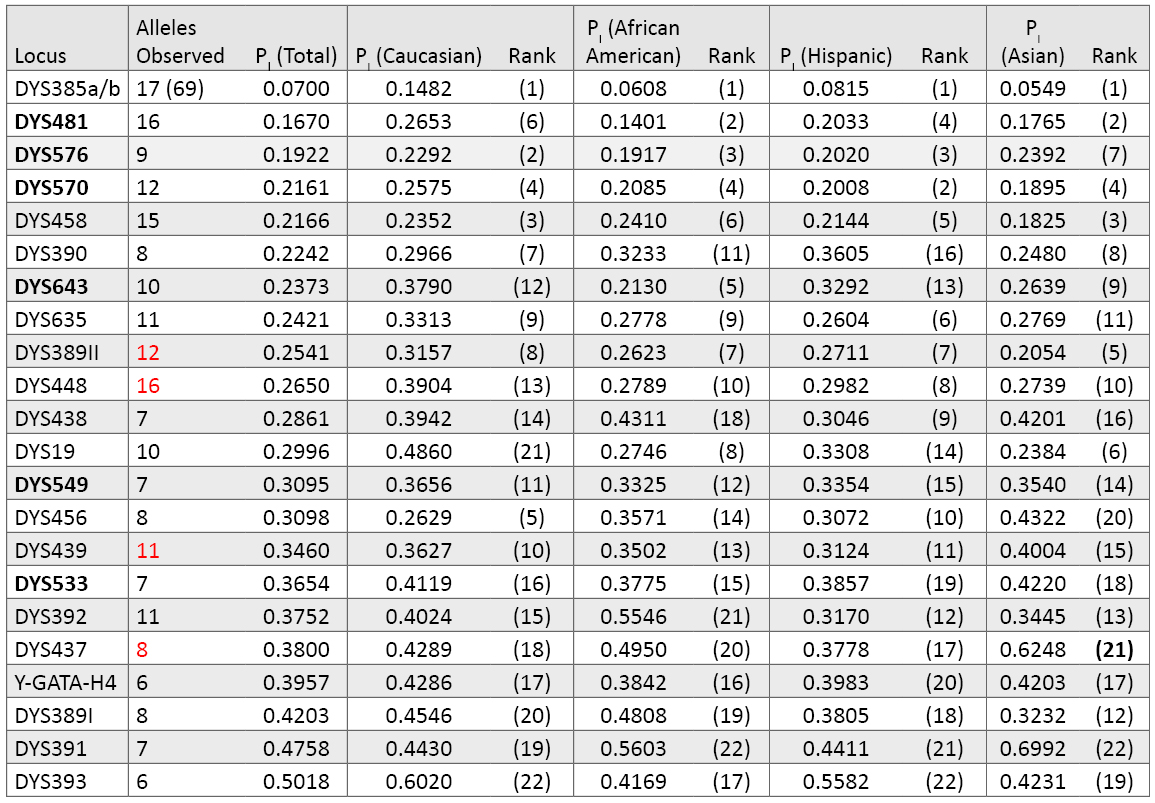 Table 7. Y-STR locus variability across 1032 males in our data set (loci are ranked by their probability of identity values). There are 17 different alleles seen in our data set for DYS385 in 69 combinations of the “a” and “b” amplicons. Numbers highlighted in red include a deletion null allele (see Table 9). The six new loci present in PowerPlex® Y23 are in bold font.
Haplotype Resolution with Various Y-STR Kits: An examination of how well subsets of data perform aids understanding of the relative value of adding new Y-STR loci to increase haplotype resolution (62) . In our data set of 1032 males, there were 70 sets of samples that contained two or more matching samples when examined with the 12 Y-STRs present in PowerPlex® Y (Table 8). Increasing the number of loci to 17 with the Yfiler® loci reduced the number of sample sets to 15 that could not be subdivided. Finally, when all 23 Y-STRs were applied to the data set, only three sets of sample pairs remained that could not be subdivided into individual sample haplotypes. There are 1026 PowerPlex® Y23 haplotypes occurring once in our dataset and three separate unresolved pairs. By comparison, the 17 Yfiler® loci produce 998 singletons, 12 pairs, two triplicates and one quadruplicate. Thus, in our dataset, PowerPlex® Y23 has a discrimination capacity of 99.7% (1029 types/1032 samples) compared to 98.2% (1013 types/1032 samples) with Yfiler® and 86.3% (891 types/1032 samples) with the original 12-locus PowerPlex® Y System (Table 8).
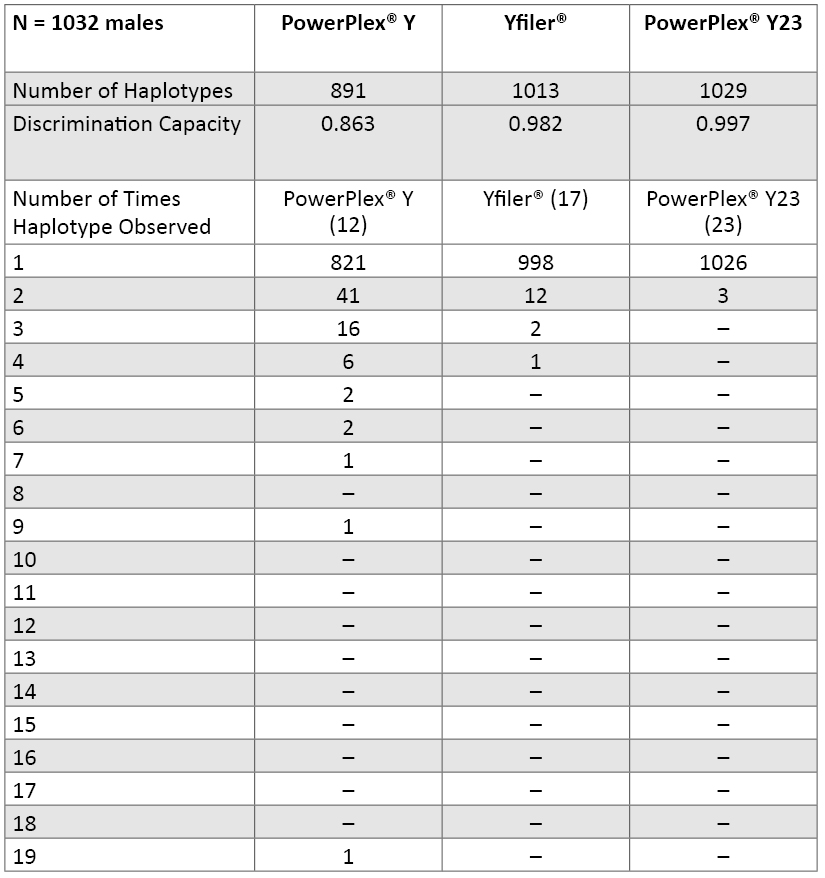 Table 8. Number of unique and shared haplotypes observed with various combinations of Y-STR loci across 1032 U.S. population samples.
 Further Examination of Matching PowerPlex® Y23 Samples: Three sets of sample pairs matched across all 23 Y-STR alleles amplified with PowerPlex® Y23: two Hispanic samples (PT84348 and ZT80369), another set of two Hispanics (C87H and GT37828), and an African American sample (ZT79304) and Hispanic sample (PT84253). These samples were carefully examined to see if they could be close male relatives.
In a previous study, the first set of Hispanic samples (PT84348 and ZT80369) could not be resolved with 37 Y-STRs (40) . However, recent examination with 14 rapidly mutating Y-STR loci described by Manfred Kayser’s group (28) showed three mutations (data not shown). The mtDNA haplogroups differ, and autosomal STR kinship calculations did not indicate any conclusive close relationships. The highest likelihood ratio (LR) was 0.2 for a first cousin assumption. On the second set of Hispanic samples, the highest likelihood ratio using autosomal STR information was 0.228 for a first cousin hypothesis (parent-child and full-sibling LRs are zero). Kinship calculations with the ZT79304-PT84253 sample pair found a likelihood ratio of 0 for parent-child, 0 for full-sib, 0.029 for half-sib and 0.568 for first cousin hypotheses. The mtDNA haplogroups were also different between these two samples. Previous testing with 37 Y-STRs (40) showed that this sample pair could be subdivided with results from DYS505 (allele 13 vs. 11), DYS532 (12 vs. 11) or DYS540 (12 vs. 13). Additional testing with rapidly mutating Y-STR loci showed three mutations between these two samples (data not shown).
PowerPlex® Y23 and Yfiler® Allelic Ladders Compared: In addition to adding six more polymorphic Y-STR loci, the PowerPlex® Y23 System includes more alleles in each allelic ladder. Across the 16 loci in common with Yfiler®, there are 66 additional alleles present in the PowerPlex® Y23 allelic ladders (Figure 2). These additional alleles can be helpful in appropriately designating rare small or large Y-STR alleles. In our data set of 1032 males, there are 15 alleles that fall outside the range of the Yfiler® allelic ladders alleles but within the range of the PowerPlex® Y23 alleles. These Yfiler® off-ladder alleles include DYS389I allele 9; DYS437 allele 18; DYS438 allele 14; DYS448 alleles 14, 15 and 16; DYS456 alleles 12 and 19; DYS458 alleles 12, 13 and 21; DYS635 alleles 17, 19 and 27; and Y-GATA-H4 allele 14.
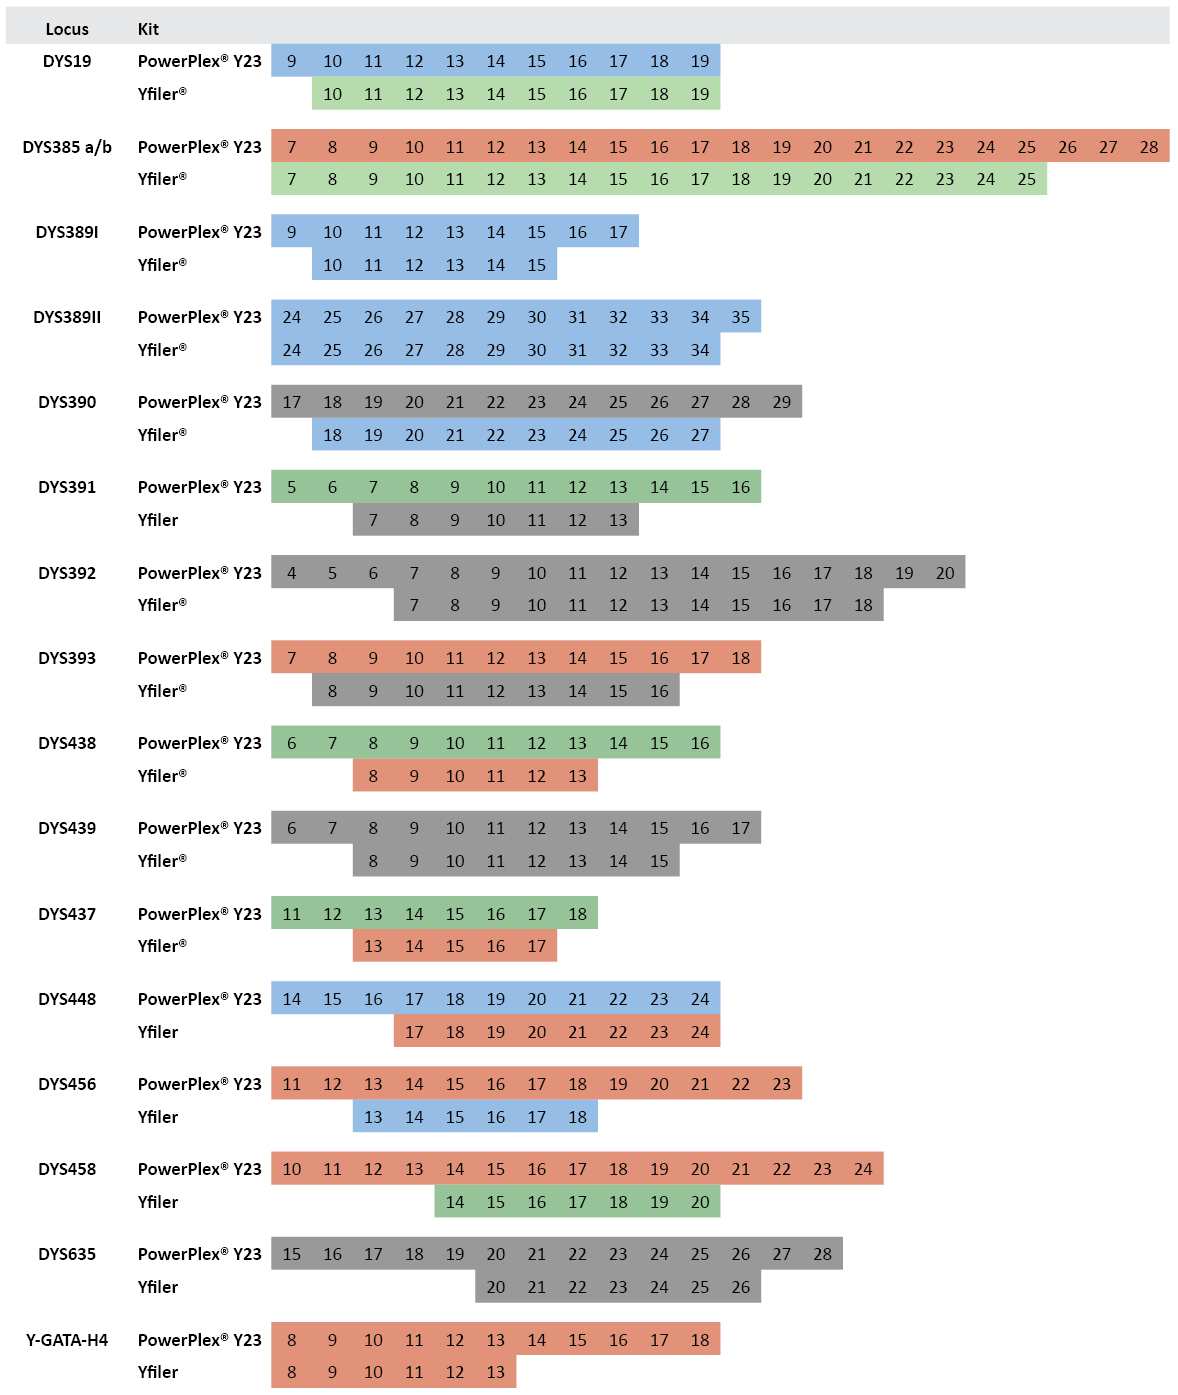 Figure 2. Comparison of allelic ladder alleles between PowerPlex® Y23 and Yfiler® kits.
 Numbers within boxes indicate allele repeat number. Colors represent dye color for the locus label in the multiplex assay.
Variant Alleles Observed in Y-STR Loci: The following Y-STR microvariant alleles were detected within our sample set: DYS385 alleles 12.2 and 13.2; DYS448 alleles 17.2 and 18.4; DYS458 alleles 16.2, 17.2, 18.2, 19.2, and 21.2; DYS481 allele 25.1; DYS635 allele 21.3; and DYS643 allele 11.1. The sequence structure of the DYS635 21.3 and DYS643 11.1 were previously reported (27) . We have also previously reported on flanking region sequence variation in DYS385 that can exist outside of some primer pairs (26) .
Copy Number Variants (Duplications, Deletions and Tri-Allelic Patterns): As previously reported, we have several duplications and two triplications at various Y-STR loci within our data set (11) (25) . Of course, DYS385 a/b is a normal duplication where different sized alleles are regularly observed (7) (26) . In some cases, duplications occur at multiple loci within a sample (25) . Table 9 lists the Y-STR duplications, triplications and deletions observed in our data set. For example, within sample PT83899, a 14,15,17 tri-allelic pattern with well balanced peak heights was observed at DYS19. A PowerPlex® Y profile of this sample is available in a previous report (25) .
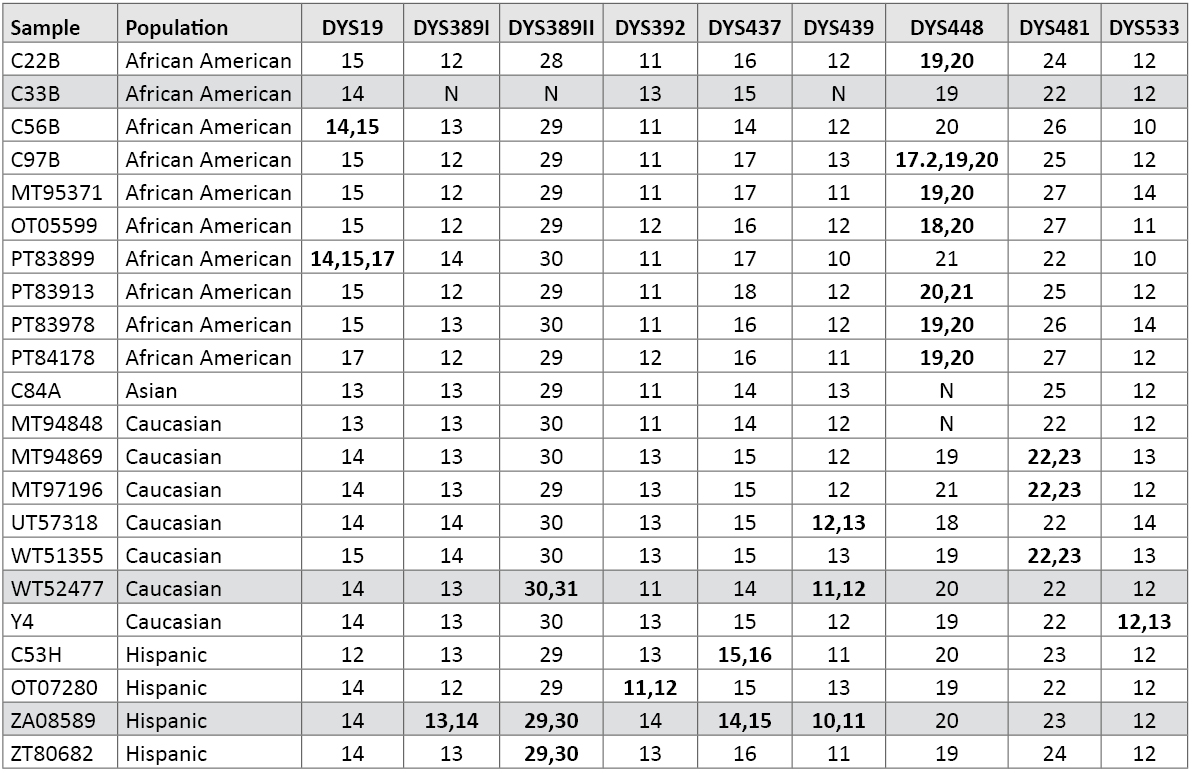 Table 9. Samples with Y-STR duplications or triplications. N = null or no result due to deletion. Shaded rows contain multiple duplications or deletions in the same sample (see reference 25).
In African American sample C33B, DYS389I, DYS389II and DYS439 fail to amplify (Table 9). This section of the Y chromosome is likely deleted, as the father of this individual also exhibits the same loss of this portion of the Y chromosome (11) . While the DYS533 12,13 duplication was previously reported (27) , the DYS481 22,23 duplication is new. We observed some form of duplication at nine of the loci amplified with PowerPlex® Y23 (Table 9).
Duplications or deletions were not observed to this degree with the autosomal STR loci examined. We only found a single tri-allelic pattern at TPOX among the 29 autosomal STR loci examined across the 1036 samples in this study. African American sample OT05588 had a fairly equal balanced TPOX 9,10,11 tri-allelic pattern when tested with multiple STR kits containing different PCR primer pairs (Figure 3).
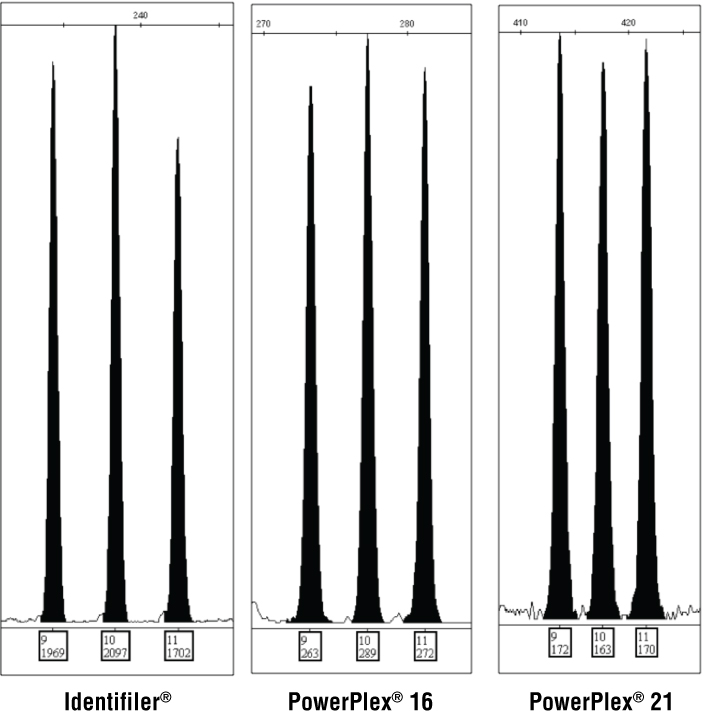 Figure 3. TPOX tri-allelic pattern observed in African American sample OT05588 with three STR kits.
 Labels under each peak display allele call and peak height.
Amelogenin Y Confirmation and DYS391 Variation: We have four female DNA samples in our data set that exhibit an amelogenin X,X type and no Y-STR profile. None of our 1032 males possessed a missing amelogenin Y allele. Therefore, we were unable to examine the capabilities of gender-confirmation assays that involve amplifying a separate region of the Y chromosome like DYS391 (4) . Samples from other regions of the world will likely benefit more from amelogenin Y confirmation assays (63) (64) .
In all 1032 male DNA samples, DYS391 was successfully amplified. We measured seven different DYS391 alleles: 7 (observed once), 8 (observed twice), 9 (observed 33 times), 10 (observed 607 times), 11 (observed 370 times), 12 (observed 18 times) and 13 (observed once). Thus, it appears that about 95% of the time either allele 10 or allele 11 will be observed. Our DYS391 allele distributions were very similar to those found in the YHRD database, which involves over 700 worldwide populations and more than 104,000 samples (see www.yhrd.org/Research/Loci/DYS391/)—namely alleles 10 and 11 are seen most frequently. DYS391 was by far the worst performer in terms of locus variability in U.S. population groups (Table 3) and did not add much in terms of an increased power of discrimination (compare last two rows in Table 5). But, the purpose of DYS391 is for gender result verification (4) and was not intended for increasing the power of discrimination in the proposed CODIS 20 set of loci as has been suggested (65) .
Conclusions
The work described in this article continues efforts previously described at the 2007 International Symposium on Human Identification with examining the impact of new autosomal and Y-chromosome STR loci (40) . By creating a large data set of U.S. population data across 29 autosomal and 23 Y-STR loci available in STR typing kits from Life Technologies/Applied Biosystems and Promega Corporation, we hope to enable users of these kits with reliable population data to underpin their work. It will be interesting to see how U.S. forensic laboratories adopt these next-generation STR kits. Hopefully our U.S. population data set will be beneficial to future use of these new loci.
For calibration of sizing measurements and traceability of allele calls to a national metrology institute in accordance with ISO 17025 requirements, NIST provides Standard Reference Materials (SRMs). SRM 2391c contains six components that have been certified for numerous autosomal STRs and the 17 Y-STRs in the Yfiler® kit (66) . We plan to update the SRM 2391c certificate soon with reference values for the additional six Y-STRs found in PowerPlex® Y23.
Plans for Our Data Release: While this article describes some basic characteristics of our population data, we plan on releasing the full information in several phases. Announcement of population data will be submitted to Forensic Science International: Genetics for both the PowerPlex® Y23 information and the 29 autosomal STR loci present in commercially available STR kits to enable citation in a peer-reviewed journal. Autosomal STR genotypes and Y-STR haplotype data will be supplied in Excel® spreadsheets on the STRBase NIST Population Data section (see www.cstl.nist.gov/biotech/strbase/NISTpop.htm) to enable use of our full data set in additional calculations and further studies. Finally, the STR locus allele frequencies will be published in the forthcoming textbook Advanced Topics in Forensic DNA Typing: Interpretation, where worked examples will be supplied using this information.
Acknowledgments and Disclaimer
STR kits were kindly provided through collaborations with Applied Biosystems, Promega Corporation and Qiagen for the purpose of collecting concordance data between various commercial kits. This work would not have been possible without support of past and present members of the NIST Human Identity Project Team including Erica Butts, Amy Decker, David Duewer, Kevin Kiesler, Margaret Kline, Kristen Lewis O’Connor, Richard Schoske and Peter Vallone. In particular, David Duewer developed and regularly refined useful Excel® spreadsheets to enable rapid data analysis. Margaret Kline sequenced STR alleles and aided characterization of primer-binding-site mutations and variant alleles. Forensic DNA research conducted at NIST is supported by an interagency agreement between the National Institute of Justice and the NIST Office of Law Enforcement Standards. Points of view in this document are those of the authors and do not necessarily represent the official position or policies of the U.S. Department of Justice. Certain commercial equipment, instruments and materials are identified in order to specify experimental procedures as completely as possible. In no case does such identification imply a recommendation or endorsement by the National Institute of Standards and Technology nor does it imply that any of the materials, instruments or equipment identified are necessarily the best available for the purpose.
Article References
- Gill, P. et al. (2006) The evolution of DNA databases—Recommendations for new European STR loci. Forensic Sci. Int. 156, 242–4.
- Gill, P. et al. (2006) New multiplexes for Europe—Amendments and clarification of strategic development. Forensic Sci. Int. 163, 155–7.
- Schneider, P.M. (2009) Expansion of the European Standard Set of DNA database loci—the current situation Profiles in DNA 12(1), 6–7.
- Hares, D.R. (2012) Expanding the CODIS core loci in the United States. Forensic Sci. Int. Genet. 6, e52–e54.
- Hares, D.R. (2012) Addendum to expanding the CODIS core loci in the United States. Forensic Sci. Int. Genet. 6, e135.
- FBI (2012) Planned process and timeline for implementation of additional CODIS core loci. (www.fbi.gov/about-us/lab/codis/planned-process-and-timeline-for-implementation-of-additional-codis-core-loci).
- Butler, J.M. (2012) Advanced Topics in Forensic DNA Typing: Methodology, Elsevier Academic Press, San Diego.
- Butler, J.M. and Hill, C.R. (2012) Biology and genetics of new autosomal STR loci useful for forensic DNA analysis. Forensic Sci. Rev. 24, 15–26.
- Katsanis, S.H. and Wagner, J.K. (2012) Characterization of the standard and recommended CODIS markers. J. Forensic Sci. [Epub ahead of print].
- Butler, J.M. et al. (2003) Allele frequencies for 15 autosomal STR loci on U.S. Caucasian, African American, and Hispanic populations. J. Forensic Sci. 48, 908–11.
- Decker, A.E. et al. (2008) Analysis of mutations in father-son pairs with 17 Y-STR loci. Forensic Sci. Int. Genet. 2, e31–5.
- Hill, C.R. et al. (2011) Concordance and population studies along with stutter and peak height ratio analysis for the PowerPlex® ESX 17 and ESI 17 Systems. Forensic Sci. Int. Genet. 5, 269–75.
- Drábek, J. et al. (2004) Concordance study between miniplex assays and a commercial STR typing kit. J. Forensic Sci. 49, 859–60.
- Hill, C.R. et al. (2007) Concordance study between the AmpFlSTR® MiniFiler™ PCR amplification kit and conventional STR typing kits. J. Forensic Sci. 52, 870–3.
- Ensenberger, M.G. et al. (2010) Developmental validation of the PowerPlex 16 HS System: An improved 16-locus fluorescent STR multiplex. Forensic Sci. Int. Genet. 4, 257–64.
- Hill, C.R. et al. (2011) Concordance testing comparing STR multiplex kits with a standard data set. Forensic Sci. Int. Genet. Suppl. Ser. 3, e188–9.
- McLaren, R.S. et al. (2012) Improved primer pair for the SE33 locus in the PowerPlex® ESI 17 Pro System. Profiles in DNA (www.promega.com/resources/articles/profiles-in-dna/2012/improved-primer-pair-for-the-se33-locus-in-the-powerplex-esi-17-pro-system/).
- Oostdik, K. et al. (2012) Developmental validation of the PowerPlex® 18D System, a rapid STR multiplex for analysis of reference samples. Forensic Sci. Int. Genet. [Epub ahead of print].
- Green, R.L. et al. (2012) Developmental validation of the AmpFlSTR® NGM SElect™ PCR Amplification Kit: A next-generation STR multiplex with the SE33 locus. Forensic Sci. Int. Genet. [Epub ahead of print].
- Butler, J.M., Shen, Y. and McCord, B.R. (2003) The development of reduced size STR amplicons as tools for analysis of degraded DNA. J. Forensic Sci. 48, 1054–64.
- Coble, M.D. and Butler, J.M. (2005) Characterization of new miniSTR loci to aid analysis of degraded DNA. J. Forensic Sci. 50, 43–53.
- Hill, C.R. et al. (2008) Characterization of 26 miniSTR loci for improved analysis of degraded DNA samples. J. Forensic Sci. 53, 73–80.
- Hill, C.R., Butler, J.M and Vallone, P.M. (2009) A 26plex autosomal STR assay to aid human identity testing. J. Forensic Sci. 54, 1008–15.
- Butler, J.M. et al. (2005) Chromosomal duplications along the Y-chromosome and their potential impact on Y-STR interpretation. J. Forensic Sci. 50, 853–9.
- Schoske, R. et al. (2004) High-throughput Y-STR typing of U.S. populations with 27 regions of the Y chromosome using two multiplex PCR assays. Forensic Sci. Int. 139, 107–21.
- Butler, J.M. et al. (2006) Allele frequencies for 27 Y-STR loci with U.S. Caucasian, African American, and Hispanic samples. Forensic Sci. Int. 156, 250–60.
- Ballantyne, K.N. et al. (2012) A new future of forensic Y-chromosome analysis: Rapidly mutating Y-STRs for differentiating male relatives and paternal lineages. Forensic Sci. Int. Genet. 6, 208–18.
- Vallone, P.M., Decker, A.E. and Butler, J.M. (2005) Allele frequencies for 70 autosomal SNP loci with U.S. Caucasian, African-American, and Hispanic samples. Forensic Sci. Int. 149, 279–86.
- Lao, O. et al. (2010) Evaluating self-declared ancestry of U.S. Americans with autosomal, Y-chromosomal and mitochondrial DNA. Hum. Mutat. 31, E1875–93.
- Fondevila, M. et al. (2012) Revision of the SNPforID 34-plex forensic ancestry test: Assay enhancements, standard reference sample genotypes and extended population studies. Forensic Sci. Int. Genet. [Epub ahead of print].
- Vallone, P.M. and Butler, J.M. (2004) Y-SNP typing of U.S. African American and Caucasian samples using allele-specific hybridization and primer extension. J. Forensic Sci. 49, 723–32.
- Fondevila, M. et al. (2012) Forensic performance of two insertion-deletion marker assays. Int. J. Legal Med. 126, 725–37.
- Diegoli, T.M. and Coble, M.D. (2011) Development and characterization of two mini-X chromosomal short tandem repeat multiplexes. Forensic Sci. Int. Genet. 5, 415–21.
- Diegoli, T.M. et al. (2011) Allele frequency distribution of twelve X-chromosomal short tandem repeat markers in four U.S. population groups. Forensic Sci. Int. Genet. Suppl. Ser. 3, e481–3.
- Saunier, J.L. et al. (2008) Mitochondrial control region sequences from a U.S. "Hispanic" population sample. Forensic Sci. Int. Genet. 2, e19–23.
- Diegoli, T.M. et al. (2009) Mitochondrial control region sequences from an African American population sample. Forensic Sci. Int. Genet. 4, e45–52.
- Just, R.S. et al. (2008) Complete mitochondrial genome sequences for 265 African American and U.S. "Hispanic" individuals. Forensic Sci. Int. Genet. 2, e45–8.
- Liu, K. and Muse, S.V. (2005) PowerMarker: An integrated analysis environment for genetic marker analysis. Bioinformatics 21, 2128–9.
- Butler, J.M. et al. (2007) New autosomal and Y-chromosome STR loci: Characterization and potential uses. Proceedings of the Eighteenth International Symposium on Human Identification
- Kline, M.C. et al. (2011) STR sequence analysis for characterizing normal, variant, and null alleles. Forensic Sci. Int. Genet. 5, 329–32.
- Bodner, M. et al. (2011) Inspecting close maternal relatedness: Towards better mtDNA population samples in forensic databases. Forensic Sci. Int. Genet. 5, 138–41.
- Sensabaugh, G.F. (1982) Biochemical markers of individuality. In Forensic Science Handbook, Saferstein, R., ed., Prentice-Hall, New York. 338–415.
- Maha, G.C. and Fuller, J.R. (2011) Allele Frequencies for Penta C in Caucasian, African American, American Indian, Asian and Hispanic Populations. Profiles in DNA (www.promega.com/resources/articles/profiles-in-dna/2011/allele-frequencies-for-penta-c/).
- Phillips, C. et al. (2012) The recombination landscape around forensic STRs: Accurate measurement of genetic distances between syntenic STR pairs using HapMap high density SNP data. Forensic Sci. Int. Genet. 6, 354–65.
- Clark, A.G., Wang, X. and Matise T. (2010) Contrasting methods of quantifying fine structure of human recombination. Annu. Rev. Genomics Hum. Genet. 11, 45–64.
- Phillips, C. et al. (2011) Analysis of global variability in 15 established and 5 new European Standard Set (ESS) STRs using the CEPH human genome diversity panel. Forensic Sci. Int. Genet. 5, 155–69.
- Budowle, B. et al. (2011) Population genetic analyses of the NGM STR loci. Int. J. Legal Med. 125, 101–9.
- O'Connor, K.L. et al. (2011) Linkage disequilibrium analysis of D12S391 and vWA in U.S. population and paternity samples. Forensic Sci. Int. Genet. 5, 538–40.
- Gill, P. et al. (2012) An evaluation of potential allelic association between the STRs vWA and D12S391: Implications in criminal casework and applications to short pedigrees. Forensic Sci. Int. Genet. 6, 477–86.
- O'Connor, K.L. and Tillmar, A.O. (2012) Effect of linkage between vWA and D12S391 in kinship analysis. Forensic Sci. Int. Genet. 6, 840–4.
- Worthen, C. et al. (2012) Evaluation of haplotypes to enhance the power of STR test kits in cases of questioned family relationships. Profiles in DNA.
- Sprecher, C.J. et al. (2009) The PowerPlex® ESX and ESI Systems: Meeting the new European standard. Profiles in DNA.
- Tucker, V.C. et al. (2011) Developmental validation of the PowerPlex® ESI 16 and PowerPlex® ESI 17 Systems: STR multiplexes for the new European standard. Forensic Sci. Int. Genet. 5, 436–48.
- Tucker, V.C. et al. (2012) Developmental validation of the PowerPlex® ESX 16 and PowerPlex® ESX 17 Systems. Forensic Sci. Int. Genet. 6, 124–31.
- Butler, J.M. et al. (2009) The single most polymorphic STR locus: SE33 performance in U.S. populations. Forensic Sci. Int. Genet. Suppl. Ser. 2, 23–4.
- Oldroyd, N. et al. (2011) Development of the AmpFlSTR® NGM SElect™ Kit: New sequence discoveries and implications for genotype discordance. Forensic News [Internet] [cited: 2011, December, 2].
- Wang, D.Y. et al. (2011) Identification and secondary structure analysis of a region affecting electrophoretic mobility of the STR locus SE33. Forensic Sci. Int. Genet. 6, 310–6.
- Butler, J.M. et al. (2011) SE33 variant alleles: Sequences and implications. Forensic Sci. Int. Genet. Suppl. Ser. 3, e502–3.
- Mulero, J.J. et al. (2006) Development and validation of the AmpFlSTR® Yfiler® PCR amplification kit: A male specific, single amplification 17 Y-STR multiplex system. J. Forensic Sci. 51, 64–75.
- Davis, C. et al. (2012) Prototype PowerPlex® Y23 System: A concordance study. Forensic Sci. Int. Genet. [Epub ahead of print].
- Decker, A.E. et al. (2007) The impact of additional Y-STR loci on resolving common haplotypes and closely related individuals. Forensic Sci. Int. Genet. 1, 215–7.
- Chang, Y.M. et al. (2007) A distinct Y-STR haplotype for Amelogenin negative males characterized by a large Y(p)11.2 (DYS458-MSY1-AMEL-Y) deletion. Forensic Sci. Int. 166, 115–20.
- Takayama, T. et al. (2009) Determination of deleted regions from Yp11.2 of an amelogenin negative male. Leg Med (Tokyo) 11, S578–80.
- Ge, J., Eisenberg, A. and Budowle, B. (2012) Developing criteria and data to determine best options for expanding the core CODIS loci. Investig. Genet. 3, 1.
- Kline, M.C. et al. (2011) The latest and greatest NIST PCR-based DNA profiling standard: Updates and status of Standard Reference Material (SRM) 2391c. Profiles in DNA (www.promega.com/resources/articles/profiles-in-dna/2011/the-latest-and-greatest-nist-pcr-based-dna-profiling-standard/).
How to Cite This Article
Scientific Style and Format, 7th edition, 2006
Butler, J.M., Hill, C.R. and Coble, M.D. Variability of New STR Loci and Kits in US Population Groups. [Internet] 2012. [cited: year, month, date]. Available from: https://www.promega.ca/resources/profiles-in-dna/2012/variability-of-new-str-loci-and-kits-in-us-population-groups/
American Medical Association, Manual of Style, 10th edition, 2007
Butler, J.M., Hill, C.R. and Coble, M.D. Variability of New STR Loci and Kits in US Population Groups. Promega Corporation Web site. https://www.promega.ca/resources/profiles-in-dna/2012/variability-of-new-str-loci-and-kits-in-us-population-groups/ Updated 2012. Accessed Month Day, Year.
Contribution of an article to Profiles in DNA does not constitute an endorsement of Promega products.
PowerPlex is a registered trademark of Promega Corporation.
AmpFlSTR, COfiler, Identifiler and SGM Plus are registered trademarks of Applera Corporation. Excel is a registered trademark of Microsoft Corporation. GlobalFiler, MiniFiler, NGM, NGM SElect, Profiler Plus, SEfiler Plus and Sinofiler are trademarks of Life Technologies, Inc. Applied Biosystems and Yfiler are registered trademarks of Applied Biosystems.